Debugging
In this article we cover the minimum required configuration to run a local GDB session and inspect a variable in memory.
Creating the necessary resources
Inside the directory root, create a directory called .vscode. Inside this directory, create a file launch.json with the following content:
{
    "version": "0.2.0",
    "configurations": [
        {
            "name": "Local App Debug",
            "type": "gdb",
            "request": "launch",
            "program": "${workspaceFolder}/build/apps/l2_patch/l2_patch_app",
            "args": [],
            "stopAtEntry": false,
            "cwd": "${workspaceFolder}",
            "externalConsole": false,
            "internalConsoleOptions": "neverOpen",
            "MIMode": "gdb",
            "miDebuggerPath": "/usr/bin/gdb",
            "setupCommands": [
                {
                    "description": "Enable pretty-printing for GDB",
                    "text": "-enable-pretty-printing",
                    "ignoreFailures": true
                }
            ]
        }
    ]
}
Note: Change the program variable to point to the actual application that will be debugged.
Rebuilding with debug symbols
The codebase needs to be rebuilt with debug symbols. It is as simple as:
cd build
cmake -DCMAKE_BUILD_TYPE=Debug .. --fresh
make
Launching
Set a breakpoint inside the C code of the target application that is about to be run under GDB. Go to the Debug tab of the Network Builder IDE. You should see the session defined inside the launch.json file. Click the start button. The local GDB session will start.
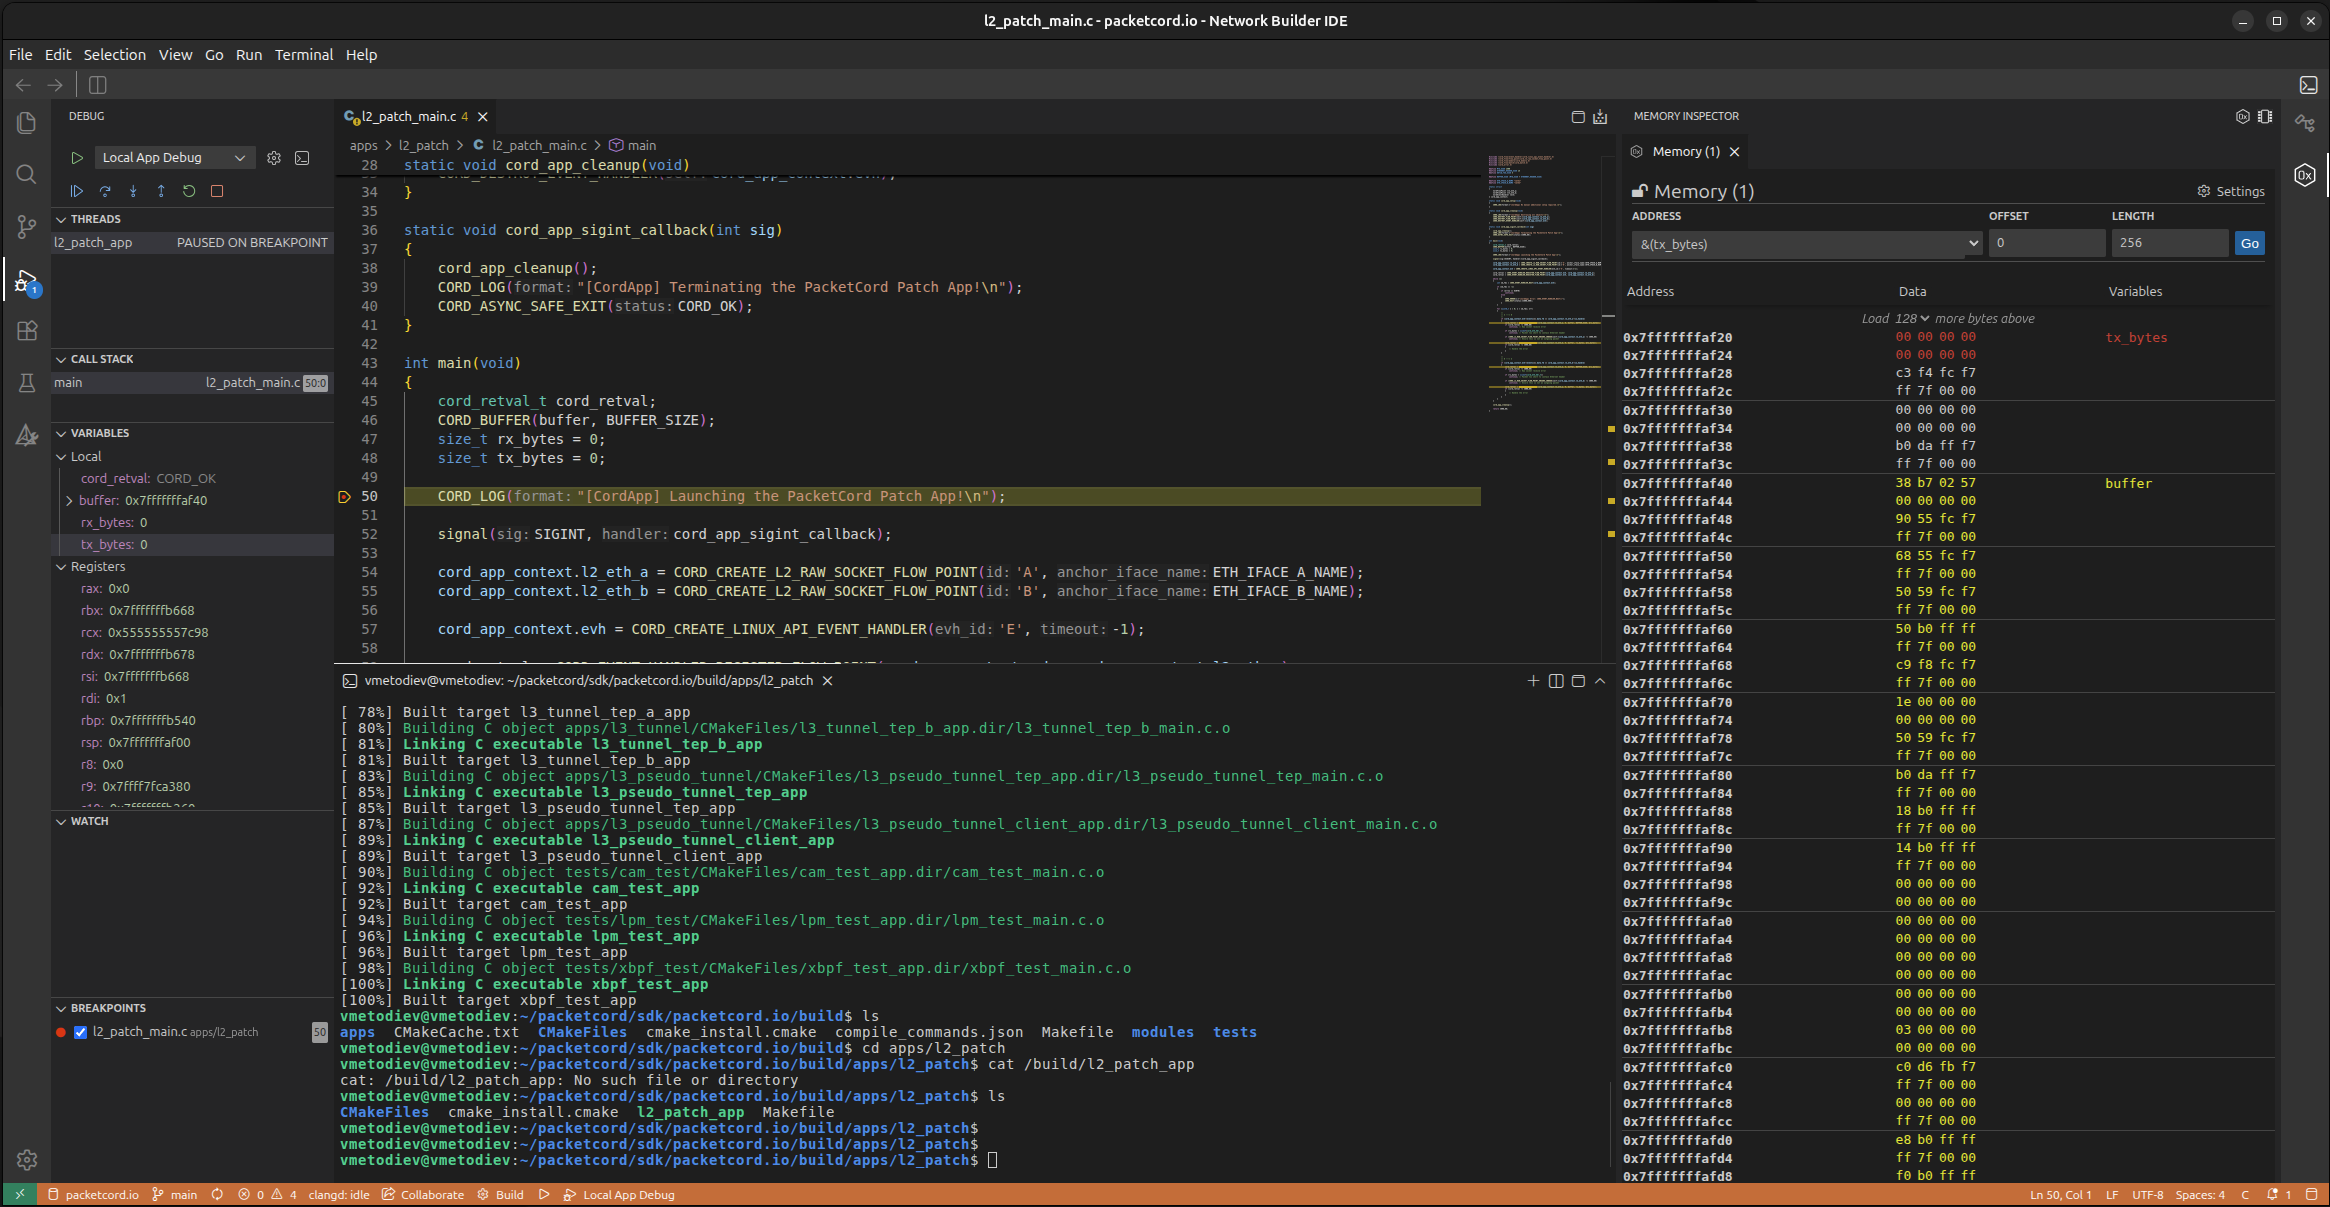
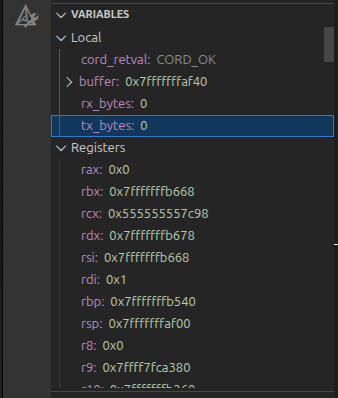
Variables can also be inspected using the Eclipse Theia's Memory Inspector - by right clicking on the variable and then selecting Show Variable in Memory Inspector.
Note: For remote debugging, consider using gdbserver over the default Docker network that bridges the container(s) to the host. Create a launch configuration accordingly.